
What this app does
Analytics for Intercom is a one click integration to get reports on your Intercom data. There are out of the box dashboards (like Acquisition, Engagement) and DIY explorers to explore the data yourself (like Segments Explorer).
How to get started with the app
Getting started is mostly just a matter of installing the app and browsing around the charts :)
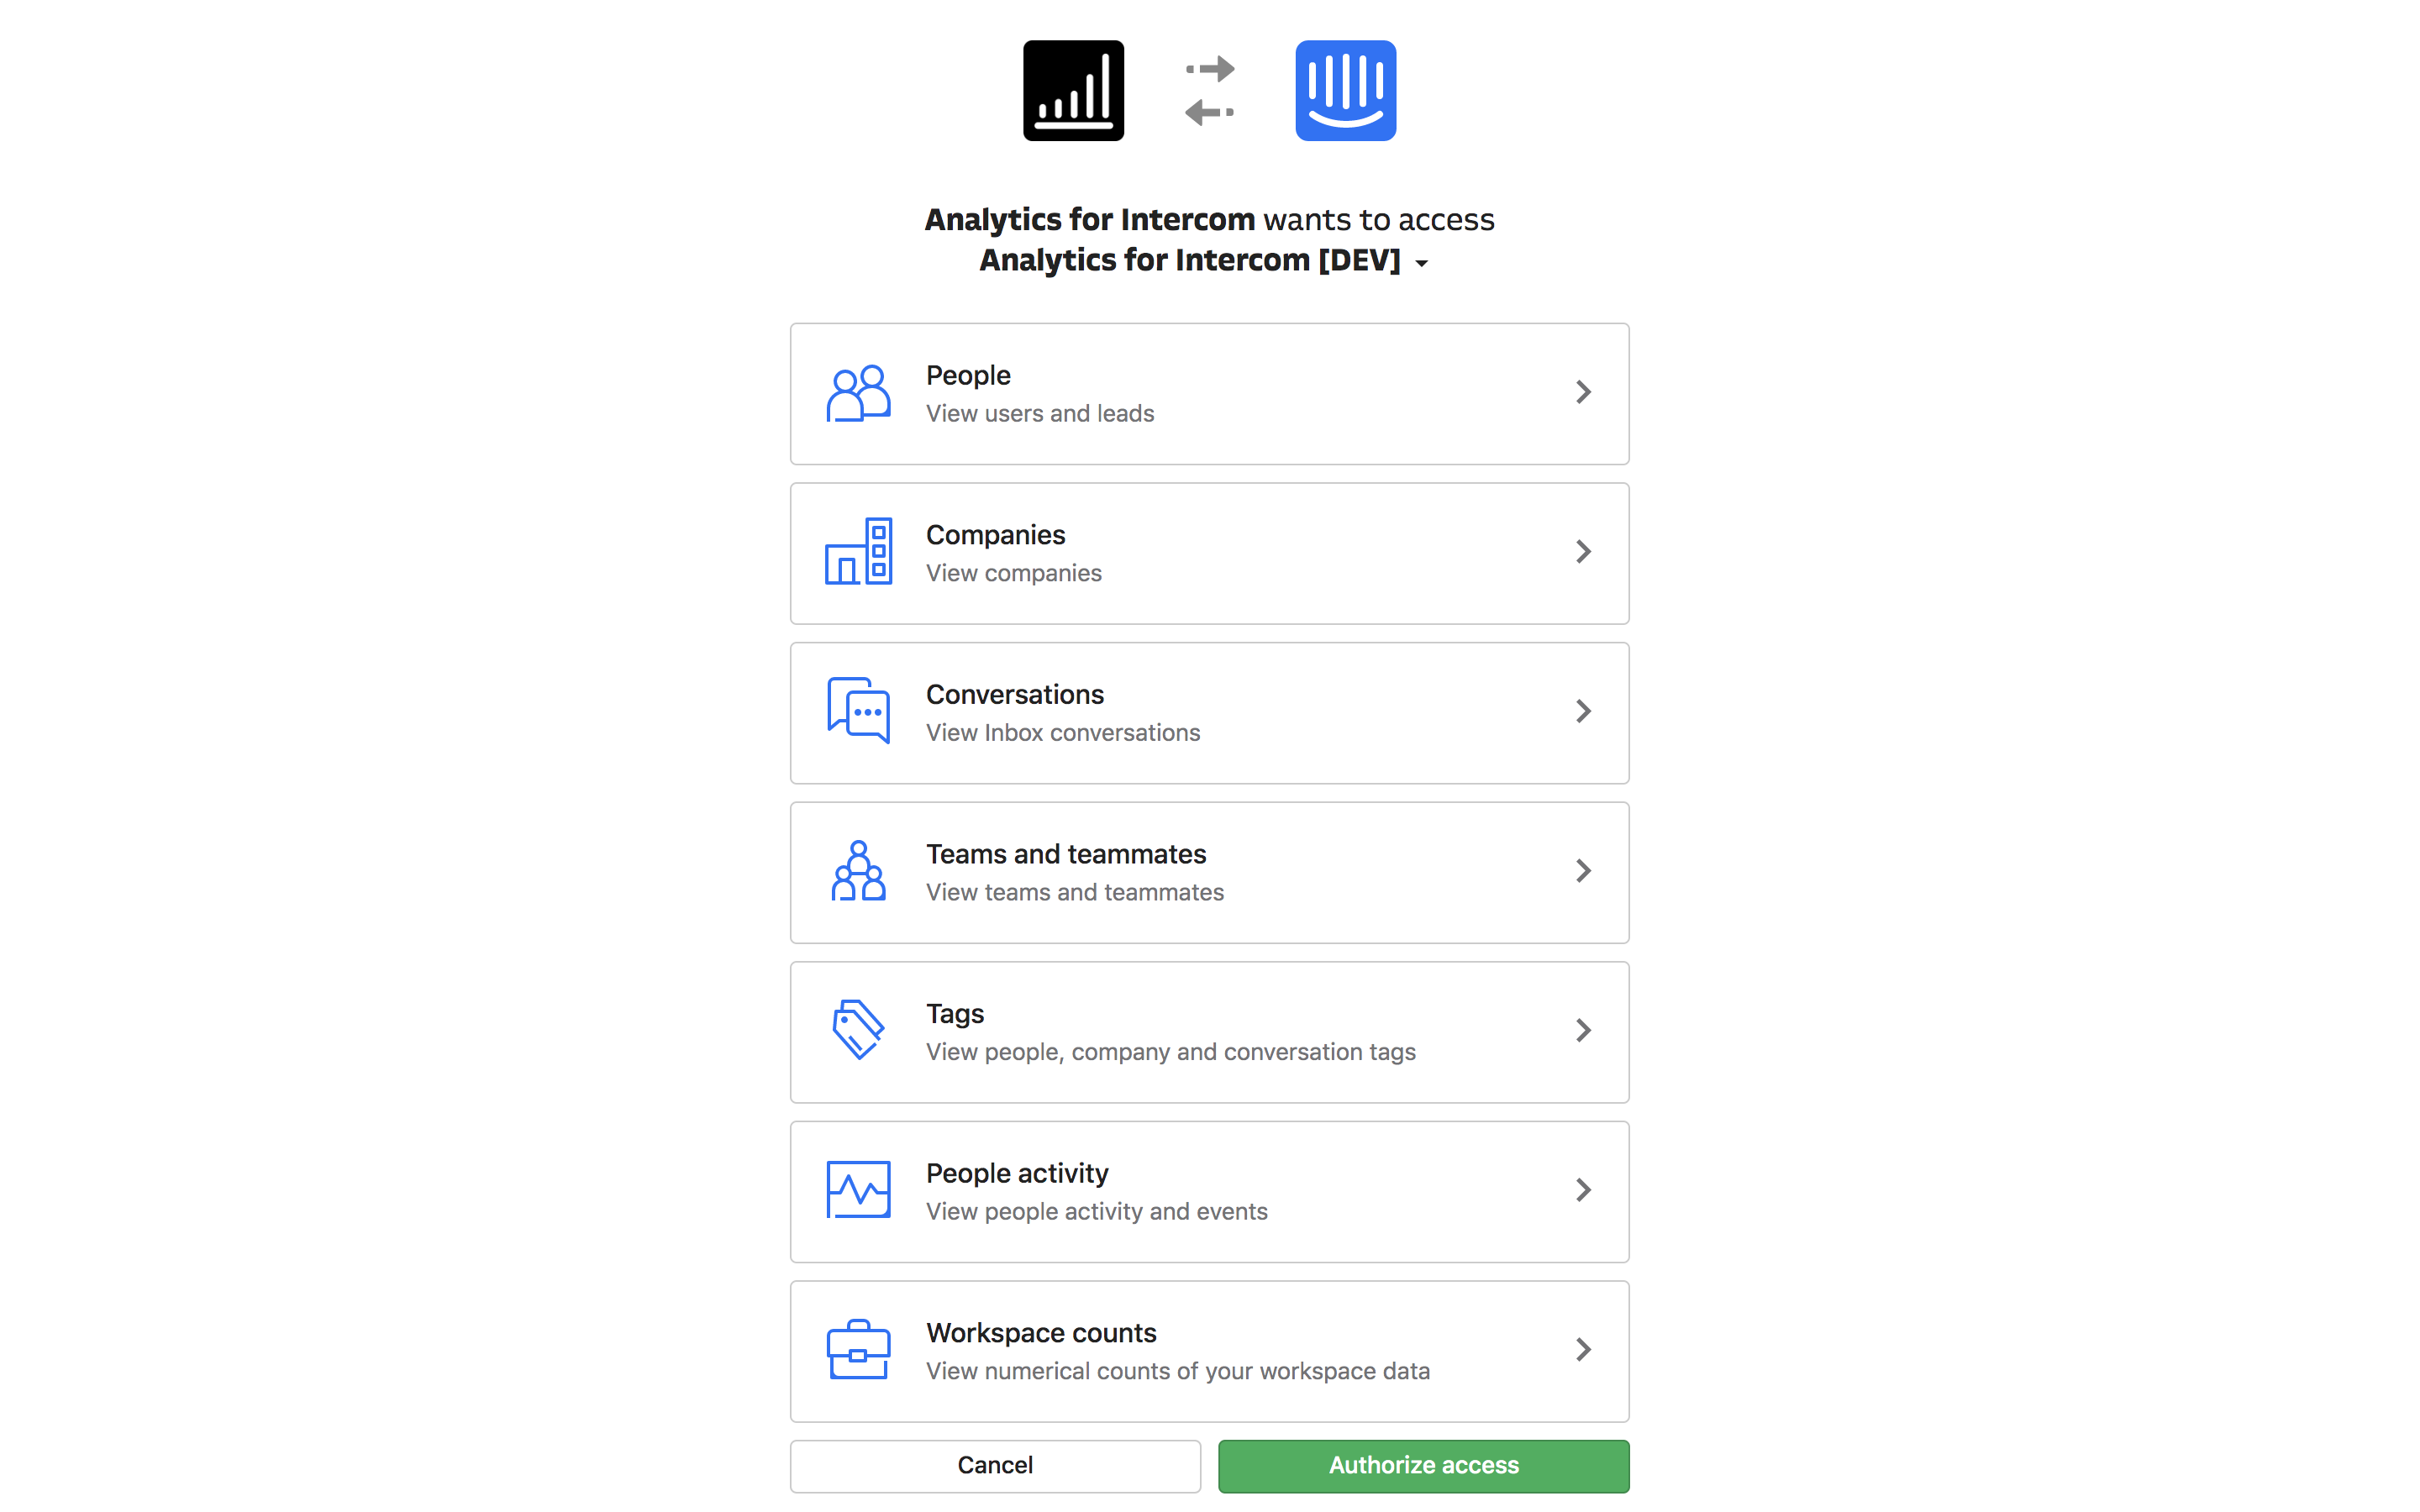
- Install the app: Go through the OAuth flow to give the app access restricted view access to your Intercom data. We request view access for your people data to plot the visualisations. For more information see below.
Browse around: You'll automatically see visualisations.
Some charts will take time to appear: We need time to accumulate data over time (like segment data) to get enough data to plot trends over time. Charts that need more time to be useful will have a disclaimer.
Permissions breakdown
- We request view permissions for users, companies, leads to plot our acquisition and engagement dashboards. Charts include new user trend over time, new company trend over time and so on.
- We request view permissions for events and attributes. This is for our events and attributes dashboards. Charts include seeing event count trend over time and attribute distribution across customers.
- We request view permissions for segments and tags for our segments explorer. Charts include seeinxg segment counts over time and segment retentions over time.
- We request view permissions for conversations for our conversation explorer. Charts include seeing conversations by revenue of account.